
User Engagement Metrics in GA4 vs Universal Analytics
With the news that Google will be sunsetting Universal Analytics and that data collection for all UA Properties will stop as of 1st July 2023, marketers and site owners need to get to grips with its successor, GA4.
But upgrading your account to GA4 comes with a few complications, not least a lack of historical data. In this post, we’re going to focus on a few key GA4 engagement metrics and dimensions you’ll encounter, and how and why these differ from Universal Analytics.

GA4 Events report
Why is Google switching off Universal Analytics?
This is kind of a complex question to answer, but an important one that will help you understand why there are some pretty drastic changes in terms of measurement. According to Russell Ketchum, director of product management at Google:
Universal Analytics was built for a generation of online measurement that was anchored in the desktop web, independent sessions and more easily observable data from cookies. This measurement methodology is quickly becoming obsolete
While Universal Analytics was largely built on a Session-based model reliant on cookies, GA4 differs pretty significantly. GA4 isn’t entirely reliant on cookies and provides far greater flexibility in how data is stored and managed, making it much more future-proof and privacy compliant. But what does this really mean from a measurement and engagement point of view? Well, it comes down to Events.
The key difference with an Event-based model
In Universal Analytics, a large amount of data that’s collected is processed as types of ‘hits’. Universal Analytics hit types included things such page hits, event hits, e-commerce hits. This highly segmented approach creates challenges in terms of advanced analysis, as these are all slightly different types of data, rather than all adhering to the same unified taxonomy.
The key difference in GA4 is that its entirely Event-based, meaning that anything and everything is now captured as an individual Event.
You might be thinking, “okay, I’m familiar with Events. These are used in UA right?”. Well, partly yes. But in GA4, we no longer have the dimensions of Event Category, Event Action and Event Label. Instead, in GA4 we have the event (let’s say a video play) and a series of parameters associated with it. These parameters can be almost anything we define, rather than being rigidly tied to Event Category, Action and Label. In short, events are everything in GA4 and can be customised to tell us almost anything.
Enhanced User Engagement out of the box
Unless you know a bit of Google Tag Manager customisation or can do some basic coding, Universal Analytics is really poor at giving insight into how engaged a visitor really is. Every single meaningful interaction you might want to track such as a link click, scroll or even the actual time a user is engaged on the site isn’t possible to measure without some customisation.
Thankfully in GA4 we have Automatically collected events. As you might expect, Automatically collected events are common interaction types that are sent to GA4 without the need for any customisation. These include things like:
scroll - the first time a user reaches the bottom of each page (i.e., when a 90% vertical depth becomes visible).
video_complete - triggered when a video that is played on the site or app reaches the end.
view_search_results - each time a user performs a site search, indicated by the presence of a URL query parameter.
Why is this such a big deal? Well, put simply, all of these types of Events previously required some form of customisation to work. Now, they are being collected automatically, and with the following parameters as standard, meaning more granular analysis of each event type is easier:
page_location
page_referrer
page_title
screen_resolution
Why is Bounce Rate not in GA4?
If you’re trying to understand how users are engaging with your content, or how a certain campaign is performing, you might typically factor Bounce Rate into your analysis. But in GA4, you’ll notice that Bounce Rate is missing. Why? Well, because it was an imperfect metric anyway.
To give a bit of context, Universal Analytics has a series of ‘engagement’ Session-based metrics. These are Bounce Rate, Average Session Duration and Pages per Session. Together, these were designed to help users understand how engaging our site or app is.
However, Bounce Rate as an out-of-the-box metric is not very useful when you really break it down. This metric is essentially just the percentage of Sessions in which a user viewed only one page. An adjusted Bounce Rate (which is possible in UA using which takes into account any Events you want do want to include as interaction events) is better, but still not ideal.
Engaged Sessions and Engagement Rate
Instead of Bounce Rate, GA4 has two metrics that provide a more nuanced and helpful understanding of what’s really going on - Engaged Sessions and Engagement Rate (%).
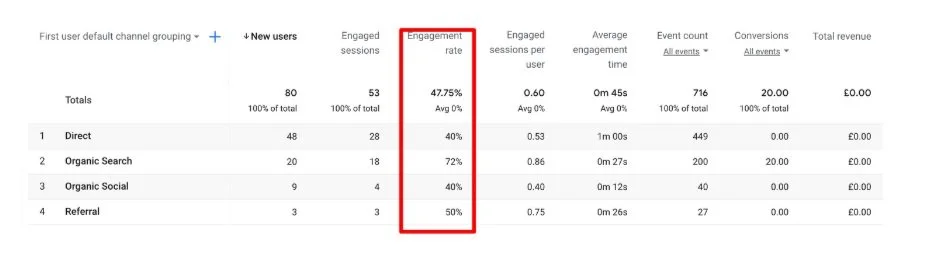
Engagement Rate in GA4
An Engaged Session is defined as one in which the user stayed on the page for 10 seconds or more, viewed more than one page, or triggered a conversion Event. Engagement Rate is therefore simply the percentage of Engaged Sessions as a proportion of overall Sessions.
Clearly, these are far more nuanced metrics than simply measuring Sessions and Bounce Rate over time, so have the potential to really help us understand engagement in a much more nuanced and meaningful way.
Other key GA4 engagement metrics
As well as Engaged Sessions and Engagement Rate (%), GA4 has also added the following:
Engaged Sessions Per User: Number of engaged sessions / total users on your site and mobile apps.
Engagement Time: The sum total of engagement time on your website and mobile apps.
Together with Engagement Rate, these metrics can be used to improve how we measure the effectiveness or ‘stickiness’ of our content, and could be a huge opportunity in particular for those looking to optimise content-heavy sites like news or entertainment. As with all engagement analysis, segmentation is of course key. Given these are automatically captured metrics, they can be viewed from a variety of helpful dimensions such as device type or default channel grouping to make them more meaningful.
Getting to grips with GA4 and User Engagement
It’s clear that with GA4 we’re entering into an entirely new phase of web analytics. As Universal Analytics has been the world’s most-used analytics platform for so long now, it will certainly take some getting used to, but there is a lot of promise once we begin to get to grips with what GA4 is capable of.
If you are looking for help upgrading to GA4, want to learn how to use GA4, or need help analysing your web performance data, reach out for a chat at hello@weareengines.com.